
Embedding Atlas
An open-source embedding visualization tool lets you explore clusters, find similar records, and cross-filter charts in Python notebooks or web apps.
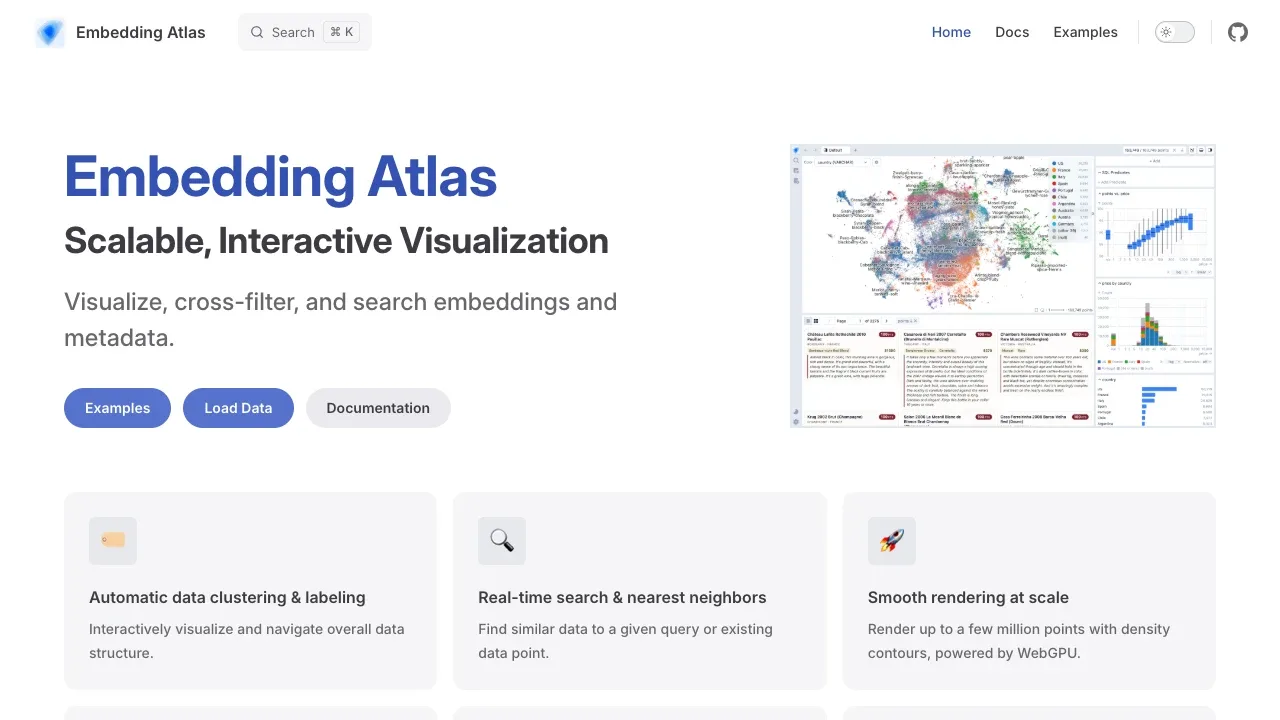
Embedding Atlas helps researchers and developers inspect embedding datasets and the records behind them. It makes clusters, outliers, and relationships visible alongside the data's metadata.
- Clusters and outliers: Automatic clustering and labels reveal groups, while density contours help distinguish crowded regions from isolated points.
- Similarity search: Search for records related to a query or find the nearest neighbors of an existing data point.
- Linked charts: Explore tabular data with charts that filter one another, including custom views such as heatmaps.
- Record viewers: Inspect text, images, and audio alongside numeric, categorical, and time fields without separating them from the visualization.
- AI agent access: Agents can use Model Context Protocol (MCP) to inspect the dataset schema, run SQL queries, create charts, and capture screenshots.
Embedding Atlas is open source under the MIT license. You can run it through a Python command line tool, use it as a Jupyter notebook widget, or include its components in web applications with React or Svelte. Its embedding view uses WebGPU to handle large datasets and keeps overlapping points readable with order-independent transparency.
 Logotyper


